How to edit labels and numbers on a chart image
Update labels, legends, and values on an exported chart, and keep units, decimals, and the data behind it consistent.
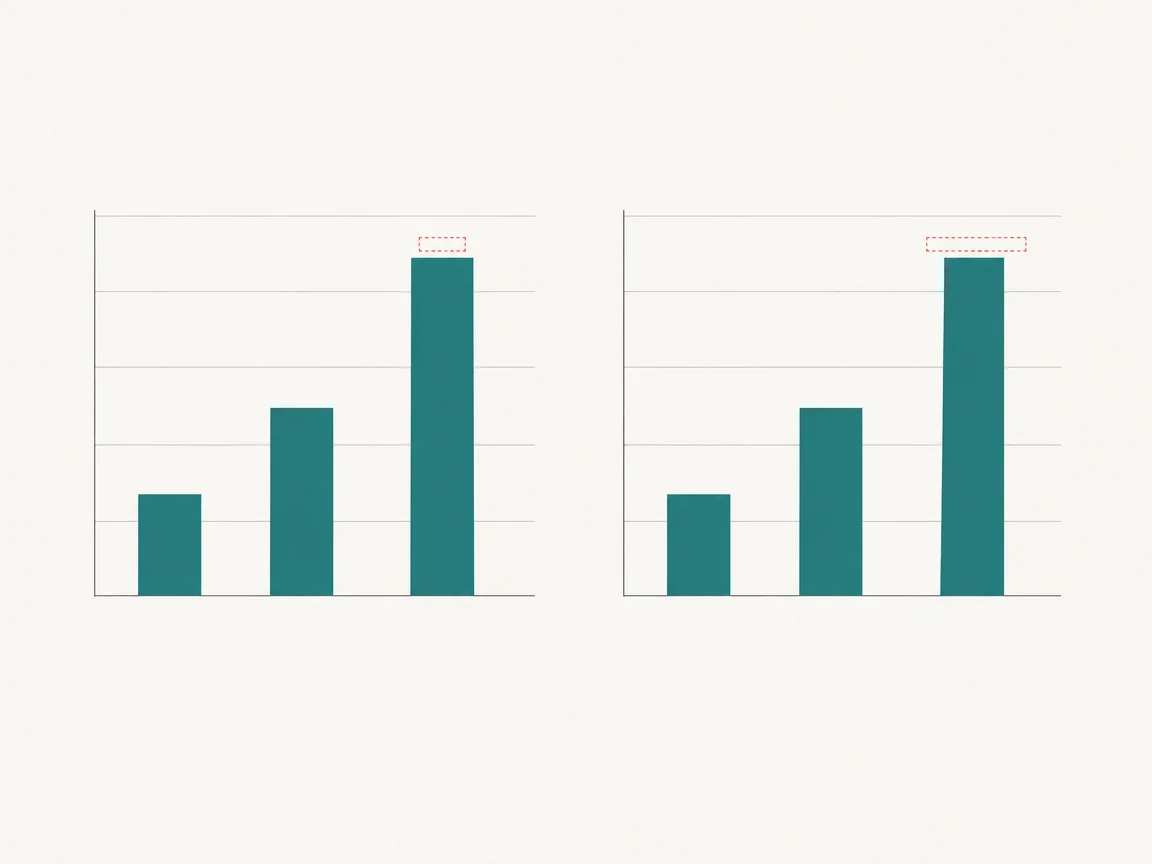
Confirm the data source first
The image only presents numbers; they must match the spreadsheet or dashboard. Write down the values you plan to change and check each one against the source after the edit.
Work from the outside in
Change axis ticks, then data labels, then the legend, then notes. If a series name changes, the legend and the notes change with it, or the chart contradicts itself.
Keep units and decimals consistent
One chart uses one style for percent signs, thousands separators, currency symbols, and decimal places. After turning 42% into 48%, check that the rest of the series is still written the same way.
Do not use an edit to hide the data
Editing fits a typo found after layout, a changed reporting basis, or a title fix. When the data itself changed, re-export the chart instead of editing numbers on the old image.
Common questions
- The data changed. Can I just edit the numbers?
- No. Re-export from the source so every value, axis, and total stays consistent. Editing one label leaves the rest of the chart describing the old data.
- The new label overlaps a bar. What now?
- Shorten the value, drop a decimal, or move the label above the plot area. Never cover the bar: readers will misread the height.